August 26, 2021

Testing Geological Origins of Fast Groundwater Pathways Using Machine Learning
New machine learning methods help scientists rank interpretations of geophysical data and understand important groundwater flow pathways in the process.
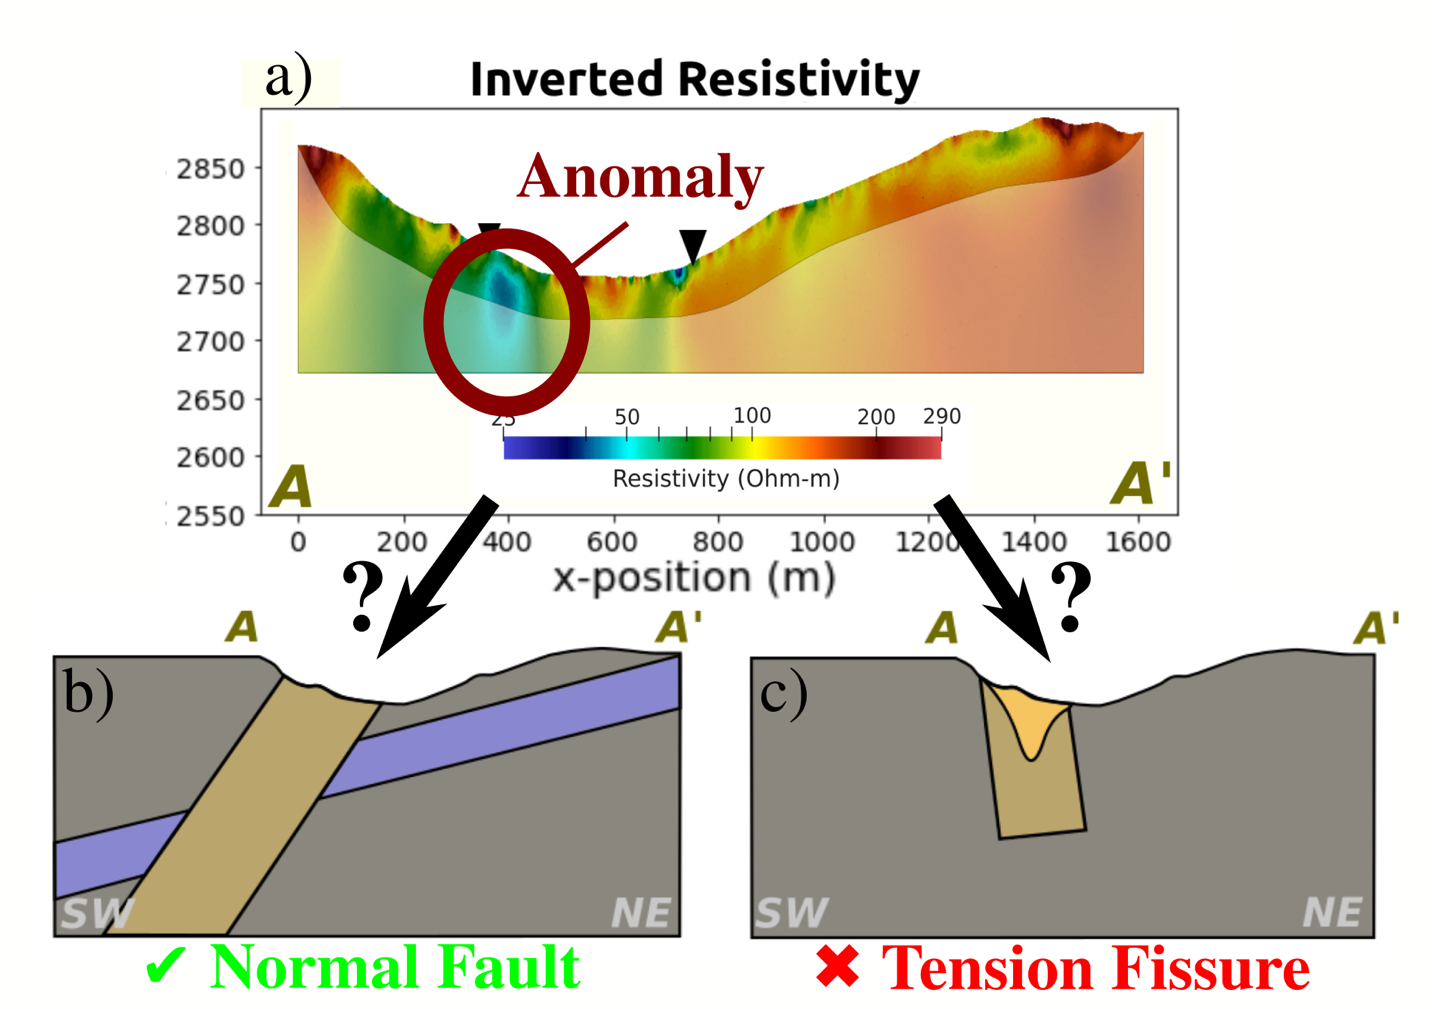
Data from the East River valley showing a geological anomaly (a). A new machine learning method tests multiple interpretations of how this feature could have formed, demonstrating that one (b) is consistent with the measured data while the other (c) is not.
[Reprinted with permission from Miltenberger, A., et al. “Probabilistic Evaluation of Geoscientific Hypotheses with Geophysical Data: Application to Electrical Resistivity Imaging of a Fractured Bedrock Zone.” Journal of Geophysical Research: Solid Earth 126 (9), e2021JB021767 (2021). [DOI:10.1029/2021JB021767] © 2022 John Wiley & Sons Ltd.]
The Science
Groundwater provides about a third of Earth’s freshwater, yet much is still unknown about where and how water moves underground. Geological features affect groundwater movement, but these structures often can’t be seen from Earth’s surface. Understanding how these features may have formed can help enhance knowledge about the broader behavior and structure of watersheds, allowing for better predictions of freshwater movement. A team of scientists developed a method to map underground flow pathways and understand how they formed. The researchers used Bayesian hypothesis testing to compare multiple interpretations, or scenarios, for what created the flow pathways, such as from a crack in earth’s surface or rock-mass movements. These interpretations were ranked by how consistent they are with measured data using machine learning. This method was applied at a fractured bedrock zone—an area of cracked and crushed subsurface rock—in the Elk Mountains of Central Colorado, where water flows much faster through these fractures than in surrounding rock. The method demonstrated that the fractured bedrock was most likely created by a fault or sedimentary layer.
The Impact
Sustainable management of groundwater is becoming urgent as groundwater resources are increasingly withdrawn in response to population increase and climate change. Mapping groundwater flow pathways is crucial for understanding freshwater behavior and movement. This research shows that machine learning can not only help scientists understand how the geology of an area forms groundwater flow pathways, but can also be applied to enhance freshwater resource management. In places affected by drought or contamination, knowing the path of groundwater flow can help conserve water or stop the spread of contaminants.
Summary
Certain structures in the earth form groundwater “highways,” where water moves faster than normal. Finding these structures is crucial for understanding when and where groundwater moves. When flow pathways are hidden below the surface, they are found by sending electrical, magnetic, and other signals into the ground and measuring how the ground responds. Since different geological formations respond differently to the signals, scientists can use the signals to find places underground that are likely to contain groundwater flow pathways. However, multiple geological structures can have similar responses, which makes it hard to choose the best interpretation of how these structures could have formed. A team of scientists developed a method to test multiple interpretations of these types of signals.
The proposed method has three parts. First, for each proposed interpretation, the signals and measurements are simulated on a computer. Second, the researchers compare the simulated data to the field data for each interpretation. Finally, using machine learning the team ranks each interpretation according to how closely it matches data gathered in the field. The research team applied this method to a zone of fractured rock in the Elk Mountains of Central Colorado. Six interpretations were proposed and ranked according to how closely they match the measurements. The team concluded that the fractured rock was from either a fault or a sedimentary layer.
Principal Investigator
Eoin Brodie
Lawrence Berkeley National Laboratory
elbrodie@lbl.gov
Co-Principal Investigator
Alex Miltenberger
Lawrence Berkeley National Laboratory
ammilten@stanford.edu
Program Manager
Jennifer Arrigo
U.S. Department of Energy, Biological and Environmental Research (SC-33)
Environmental System Science
jennifer.arrigo@science.doe.gov
Funding
This work is part of the Watershed Function Scientific Focus Area funded by the U.S. Department of Energy (DOE) Office of Science Biological and Environmental Research (BER) Program (Award Number DE-AC02-05CH11231). Additional support comes from the DOE Office of Science’s Office of Workforce Development for Teachers and Scientists (WDTS) and the Office of Science Graduate Student Research (SCGSR) program. The SCGSR program is administered by the Oak Ridge Institute for Science and Education for the DOE under contract number DE‐SC0014664. The authors would also like to thank the sponsors of the Stanford Center for Earth Resources Forecasting and the Dean (Prof. Stephan Graham) of the Stanford School of Earth, Energy, and Environmental Sciences for supporting this research.
References
Miltenberger, A., et al. "Probabilistic Evaluation of Geoscientific Hypotheses with Geophysical Data: Application to Electrical Resistivity Imaging of a Fractured Bedrock Zone." Journal of Geophysical Research: Solid Earth 126 (9), e2021JB021767 (2021). https://doi.org/10.1029/2021JB021767.