April 01, 2024
Exploring Urban Heat Islands and Temperature Inequality in U.S. Cities
Using satellite data to understand how city design impacts temperature variations.

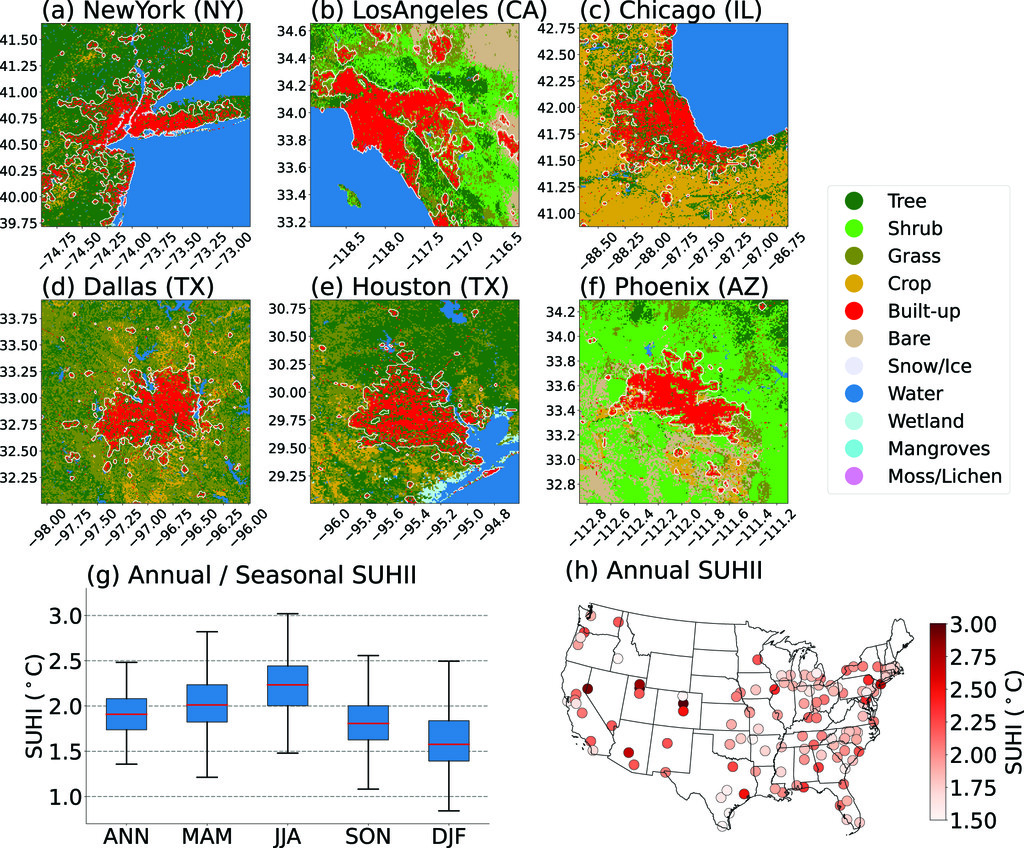
Land cover of the six largest cities analyzed. The white line delineates the boundary between urban and nonurban areas, determined by applying Gaussian smoothing (a-f). Distribution of annual and seasonal surface urban heat island intensity (SUHII) across all 120 cities (g). A spatial depiction of the cities with their corresponding annual mean SUHII values (h).
[Reprinted under a Creative Commons Attribution 4.0 International License (CC BY 4.0) from Lee, J. "Assessment of U.S. Urban Surface Temperature Using GOES-16 and GOES-17 Data: Urban Heat Island and Temperature Inequality." Weather, Climate, and Society 16(2), 315–29 (2024). DOI:10.1175/WCAS-D-23-0129.1.]
The Science
A team of researchers used satellite data to study how temperatures vary in 120 large U.S. cities. By examining how heat changes throughout the day and year, the study found green spaces and reflective surfaces help cool cities and urban areas get hotter as they become more developed. Vulnerable communities often live in these hotter areas, facing more extreme heat. This research provides insight into how city planning can reduce these temperature differences.
The Impact
Certain areas in cities are much hotter than others, especially where vulnerable communities live. By understanding these temperature patterns, city planners can design better strategies to cool hot spots. This can lead to fairer living conditions and reduce health risks associated with extreme heat.
Summary
The study used hourly land surface temperature (LST) data from the Geostationary Operational Environmental Satellite–16 (GOES-16) and GOES-17 to analyze the surface urban heat island intensity (SUHII) in the 120 largest U.S. cities and their surrounding areas. The analysis reveals distinct patterns in seasonal and diurnal SUHII, with the enhanced vegetation index and albedo significantly influencing temperature variations. SUHII’s diurnal cycle shows climate conditions, urban and nonurban land covers, and nighttime human activities affect SUHII peaks differently.
Examining intracity LST dynamics revealed a strong correlation between urban intensity (UI) and LST, indicating LST rises with increasing UI. Vulnerable populations, identified using the social vulnerability index, are often located in high UI regions, resulting in notable LST inequality. These communities face higher LST conditions, potentially leading to greater heat exposure risks. This study highlights the need for city-specific climate change mitigation strategies addressing LST variations and their societal implications, aiming to create cooler and more equitable urban environments.
Principal Investigator
Max Berkelhammer
University of Illinois Chicago
[email protected]
Program Manager
Sally McFarlane
U.S. Department of Energy, Biological and Environmental Research (SC-33)
Urban Integrated Field Laboratories
[email protected]
Funding
This material is based upon work supported by the U.S. Department of Energy, Office of Science, Biological and Environmental Research program’s Urban Integrated Field Laboratories Community Research on Climate and Urban Science research activity under Award Number DE-SC0023226.
References
Lee, J. "Assessment of U.S. Urban Surface Temperature Using GOES-16 and GOES-17 Data: Urban Heat Island and Temperature Inequality." Weather, Climate, and Society 16 (2), 315–29 (2024). https://doi.org/10.1175/WCAS-D-23-0129.1.

