September 08, 2023
Estimating Permafrost Distribution and Covariability with Landscape Characteristics
Combined temperature and electrical resistivity measurements show permafrost distribution and its relation to the topographic position and vegetation characteristics.

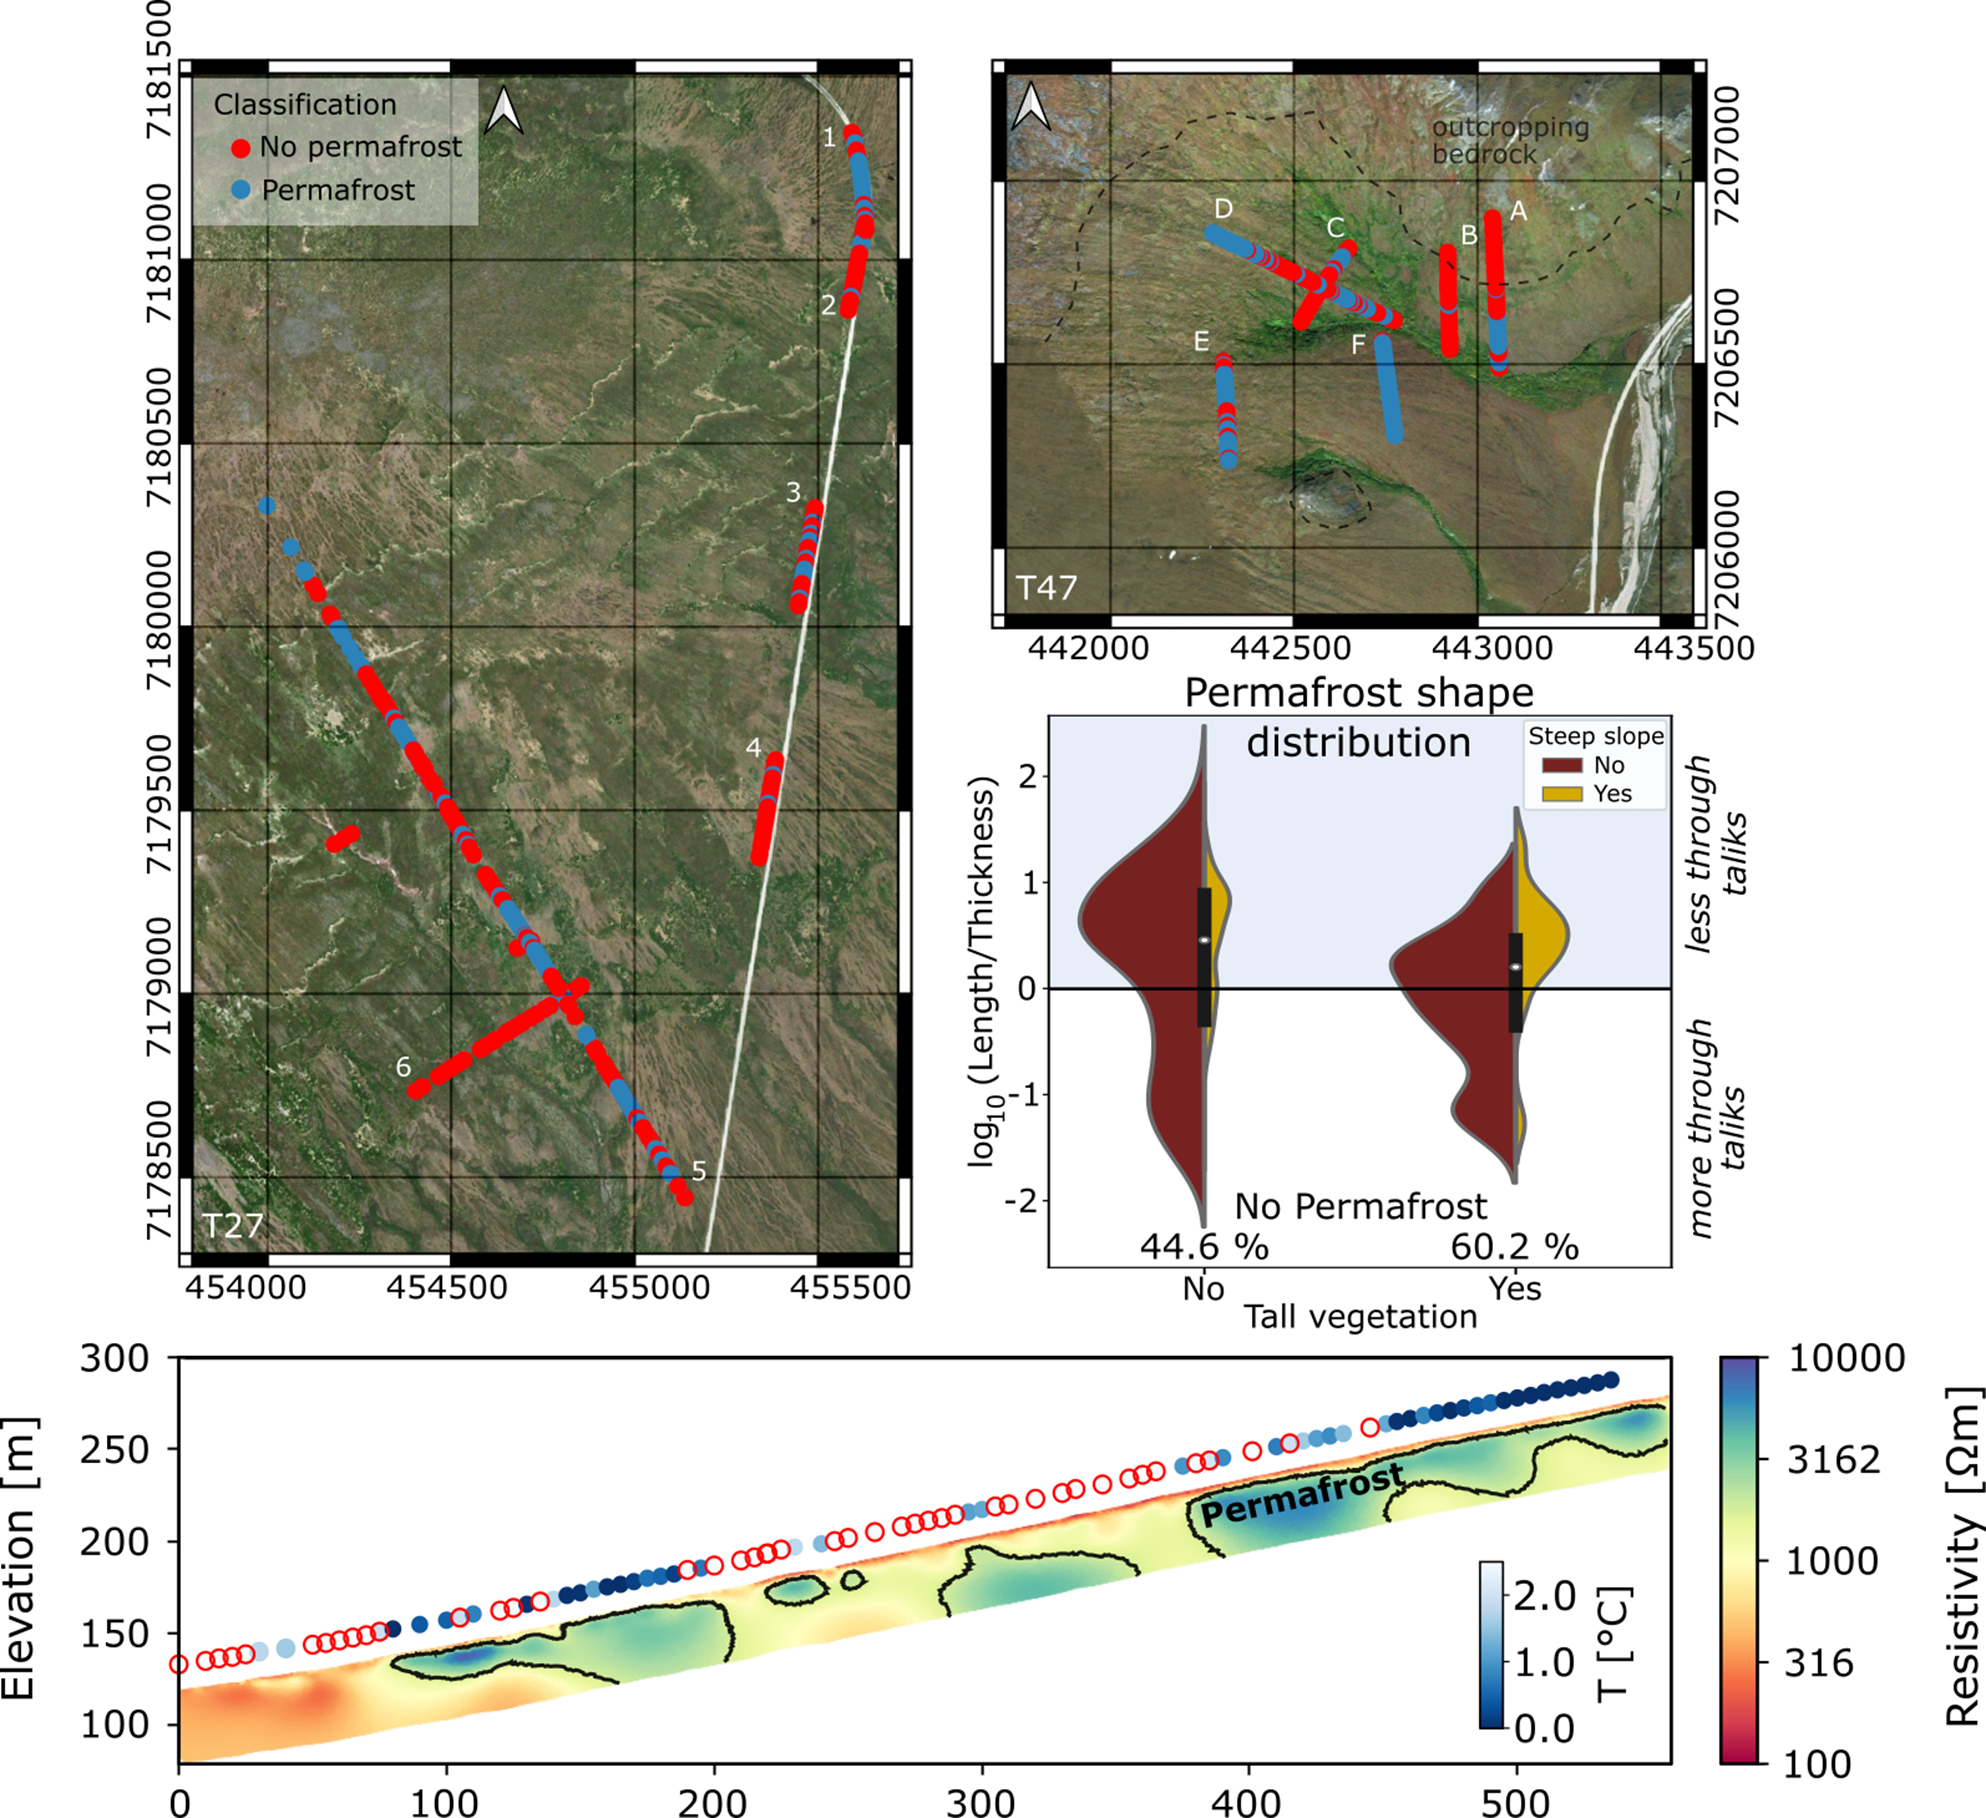
Estimated distribution of shallow permafrost across 2 of 3 studied watersheds (top left and right). Distribution of permafrost shape with varying vegetation cover and slope gradient (center right). Imaged shape of permafrost in the ground (bottom).
[Reprinted under a Creative Commons Attribution 4.0 International License (CC BY 4.0) from Uhlemann, S., et al. "Estimating Permafrost Distribution Using Co-Located Temperature and Electrical Resistivity Measurements." Geophysical Research Letters 50 (17), e2023GL103987 (2023). DOI:10.1029/2023GL103987.]
The Science
Understanding permafrost distribution in the subsurface will help scientists better understand Arctic change due to climate warming. Although ground temperature can be measured in boreholes, few boreholes exist to do these measurements. Researchers measured the temperature and electrical resistivity of the ground on the Seward Peninsula in Alaska and used machine learning to gather details about the permafrost. By linking permafrost properties with observations aboveground, researchers demonstrated the slope aspect and angle and the vegetation exhibit correlation with permafrost size and temperature.
The Impact
As climate warming changes the Arctic landscape above and below the surface, knowing where and how deep the ground is frozen is crucial to predict how the Arctic will change. A combination of temperature and electrical resistivity measurements can provide reliable estimates of permafrost location and depth. Research also shows a direct link between the state of permafrost and its location on hillslopes. Knowing such relationships can improve estimates of where permafrost exist and help predict Arctic change.
Summary
Assessing the lateral and vertical extent of permafrost is critical to understanding Arctic ecosystems’ fate under climate change. Yet, direct measurements of permafrost distribution and temperature are often limited to few borehole locations. In this study, researchers assessed the use of co-located ground temperature and ground electrical resistivity measurements to estimate at high resolution the distribution of permafrost in 3 watersheds underlain by discontinuous permafrost. Synthetic modeling showed that combining co-located temperature and electrical resistivity tomography using machine learning methods can identify permafrost distribution more accurately than conventional methods. By linking the size of the identified permafrost bodies to surface observations, researchers showed that tall vegetation (>0.5 m) and gentle slopes (<15°) are related to warmer and smaller permafrost bodies and a more frequent occurrence of taliks. In addition, results indicate that talik occurrence is not always associated with tall shrubs, confirming a variety of trajectories in temperature and vegetation dynamics across the landscape.
Principal Investigator
Baptiste Dafflon
Lawrence Berkeley National Laboratory
bdafflon@lbl.gov
Program Manager
Daniel Stover
U.S. Department of Energy, Biological and Environmental Research (SC-33)
Environmental System Science
daniel.stover@science.doe.gov
Funding
This research is part of the Next-Generation Ecosystem Experiments (NGEE) Arctic project, which is funded by the Biological and Environmental Research program in the U.S. Department of Energy’s Office of Science (Grant DE-AC02-05CH11231).
References
Uhlemann, S., et al. "Estimating Permafrost Distribution Using Co-Located Temperature and Electrical Resistivity Measurements." Geophysical Research Letters 50 (17), e2023GL103987 (2023). https://doi.org/10.1029/2023GL103987.

